Odaiba Tokyo: Things to Do on the Artificial Island
Discover Odaiba, Tokyo’s artificial island: attractions, beaches, museums and bay views for a memorable waterfront escape in the capital.
The figure of 123,767,642 inhabitants is attributed to Japan’s Ministry of Internal Affairs and Communications for the beginning of 2026, but its connection to that year remains to be confirmed. To find the number of inhabitants on a specific date, consult the corresponding publication from the Statistics Bureau of Japan and distinguish between a census, resident register and estimate.
The underlying trend is clearer: Japan’s population is declining and ageing, while residents are becoming increasingly concentrated in large urban areas. This development is changing requirements for housing, transport, care staff and public services. A high population density around major stations can therefore coexist with rural municipalities that are losing residents.
In brief
A dated official total should be preferred to a figure presented as an instant counter. Population clocks update a result based on assumptions about births, deaths and migration: they do not record every event in real time.
Japanese demography uses several tools. The census describes the population on a reference date, administrative registers track registered residents, and estimates update the total based on known demographic movements.
The resident population and the population of Japanese nationality do not refer to the same group. Depending on the statistical series, foreign residents may be included in the total or presented separately; a visitor passing through cannot be treated as an inhabitant.
This distinction matters when one headline announces a fall in the number of Japanese people while another describes an increase in foreign residents. These movements can occur simultaneously, without immigration necessarily offsetting the overall decline.
Countrymeters gives a total of 125,773,167 inhabitants at the beginning of 2026. This result differs from the figure attributed to the Japanese ministry: you should neither average the two nor assume that the gap is solely explained by population movements.
The reference date, statistical coverage and version of the model must be compared before interpreting the figures. For professional or administrative purposes, check the total with the Statistics Bureau of Japan rather than reusing a secondary estimate.
The same caution applies to projections from the United Nations Population Division. Its 2024 revision provides an international reference framework, but a projection for a later year remains different from a population total actually observed.
A precise figure is only useful if you know exactly whom it counts and on what date.
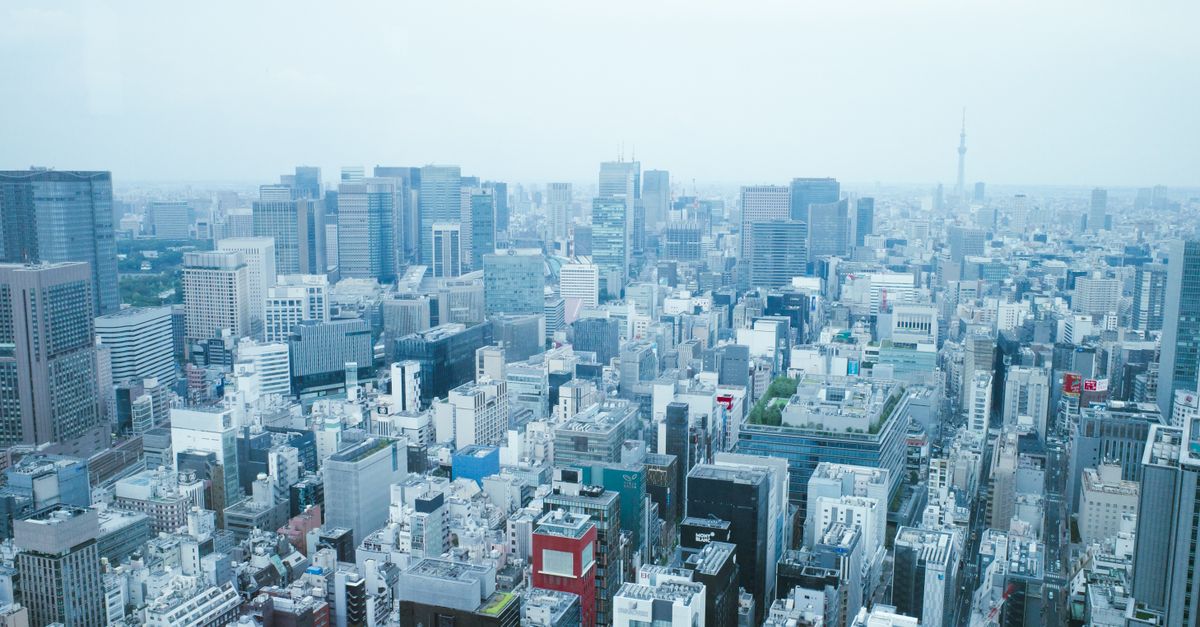
Worldometer gives a density of 336 inhabitants per square kilometre for 2026, calculated over a land area of 364,555 square kilometres. This indicator expresses a national average, not the density of a residential neighbourhood or of habitable areas alone.
Mountainous terrain limits the continuity of built-up areas. Housing, activities and infrastructure are more concentrated in plains and transport corridors, making the distribution of the population highly uneven.
A station serving a major employment area attracts shops, apartment buildings and transport connections. Conversely, a mountainous area may contain large sparsely populated spaces while still having towns where services remain concentrated.
Density alone therefore cannot measure everyday comfort. Housing size, access to green spaces, transport frequency and distance to services provide additional information.
When planning a move, the Tokyo guide can help you understand differences between neighbourhoods rather than treating the capital as a uniform space. Choosing a railway line and station may matter more than the administrative address alone.
| Indicator | Estimate published by Worldometer for 2026 | Interpretation |
|---|---|---|
| National density | 336 inhabitants per square kilometre | Average calculated over the selected land area |
| Urban population share | 93.4% | Share depending on the statistical definition of urban |
| Urban population | 114,292,213 inhabitants | Estimate to be used with the national total from the same series |
These figures belong to the same statistical presentation. It would be incorrect to compare this urban population with a national total from Countrymeters or a Japanese register without checking that they are compatible.
The concentration of residents in accessible areas explains Japan’s contrasts better than national density alone.
A large urban population does not mean that everyone lives in high-rise neighbourhoods. Urban areas also include low-rise residential districts, industrial outskirts and residential municipalities connected to city centres by train.
The Tokyo, Osaka and Nagoya areas illustrate this organisation. Their functional boundaries, defined notably by commuting patterns, extend beyond the borders of a single municipality.
Comparing cities requires using the same boundaries. A municipality, prefecture and urban area are not interchangeable units; different rankings can therefore assign very different totals to the same geographical name.
In Osaka, daily travel connects neighbouring municipalities that form part of a continuous urban area. The Osaka guide helps place neighbourhoods within this metropolitan system, beyond municipal boundaries alone.
Population decline does not imply a uniform decrease in every neighbourhood. An area close to jobs, educational institutions or transport can attract households while other districts lose residents.
This internal movement changes local needs. A neighbourhood welcoming young families may need childcare services, while an ageing area requires greater access to healthcare and suitable mobility solutions.
Tourist flows must also be distinguished from resident totals. A busy shopping street in Kyoto does not show how the number of inhabitants in the neighbourhood is changing.
To understand this organisation, transport in Japan is a useful starting point: it connects homes with jobs and services. Attractiveness depends as much on accessibility as on the number of people already settled there.
Worldometer estimates Japan’s median age at 50.2 years in 2026. This means that the population is divided around this age, with one half younger and one half older; it is not the average age.
Demographic ageing results from several mechanisms. Longer lives allow more people to reach advanced ages, while smaller birth cohorts gradually reduce the proportion of young people.
For 2026, Worldometer gives life expectancy at birth as 85.1 years, with 88.2 years for women and 82.1 years for men. These estimates should not be confused with the results of an official Japanese life table published for another year.
The indicator is a theoretical duration calculated from the mortality conditions selected. It does not predict the lifespan of a specific person or the number of years they will live without reduced independence.
Ageing increases the importance of accessible housing, nearby healthcare and support at home. In a municipality where services are far away, being able to reach a shop or medical facility becomes as practical an issue as having suitable accommodation.
However, the age structure alone is not enough to measure economic dependency. An older person may work, help relatives or take part in community activities, while an adult statistically considered to be of working age may be a student or unemployed.
Demographic ratios therefore shed light on the composition of society without fully describing its economic exchanges. Living longer and living longer in good health are two distinct objectives.
Worldometer estimates the total fertility rate at 1.2 children per woman in 2026. This indicator summarises fertility behaviour during a period; it does not automatically correspond to the final number of children women in a generation will have.
The birth rate measures something else: the frequency of births in relation to the total population. An ageing country may record fewer births because the generations of childbearing age are becoming smaller, even if their behaviour changes little.
Family decisions take place within constraints involving housing, employment, time and childcare. Financial assistance may reduce some expenses, but it does not replace a work organisation that allows parents to care for a child.
The distribution of family responsibilities also deserves examination. The difficulties faced by single-parent families in Japan show why access to services and income stability matter as much as discussions about the birth rate.
The cost of living in Japan should be assessed locally: housing, transport and proximity to services create different circumstances depending on where you live. Applicable prices and support should be checked with the relevant organisations.
Changes in the number of inhabitants combine natural change, resulting from births and deaths, with net migration. A net inflow of residents may lessen a decline without necessarily cancelling it.
Long-term settlement also requires practical conditions: access to housing, language learning, schooling and employment stability. As procedures may change, applicable rules should be checked with Japan’s Immigration Services Agency.
Finally, a projection is based on assumptions about fertility, mortality and migration. It is used to plan facilities and public policy, not to announce a certain future population total.
The total depends on the date and statistical scope. To obtain an official figure, consult the dated publication from the Statistics Bureau of Japan and check whether it covers all residents or Japanese citizens only.
Residents and activities remain concentrated in large urban areas and accessible plains. A national decrease can therefore coexist with dense neighbourhoods and busy transport networks.
Median age divides residents into a younger half and an older half. Life expectancy estimates a theoretical duration based on the mortality conditions selected.
A positive net migration balance can lessen the decline in the number of inhabitants. Its effect depends on its scale, natural change and how long new residents remain in the country.
Updated on 17/10/2026
Scroll to see more articles →